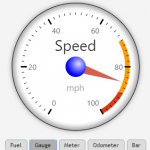
We searched for some nice way to visualize data as tachometer – and found the JavaScript library RGraph. So we built some bridge to make it really easy to produce RGraph-visualizations within the context of the CaptainCasa application processing.
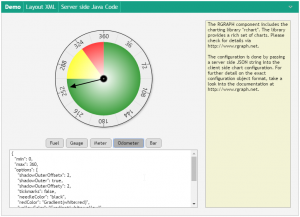
The serve side actually creates a JSON representation of the configuration that is passed into the chart instance on client side. So any flexibility that is provided by RChart is usable.
Please find some overview information within this video:
Please find the web site behin RChart >HERE<.